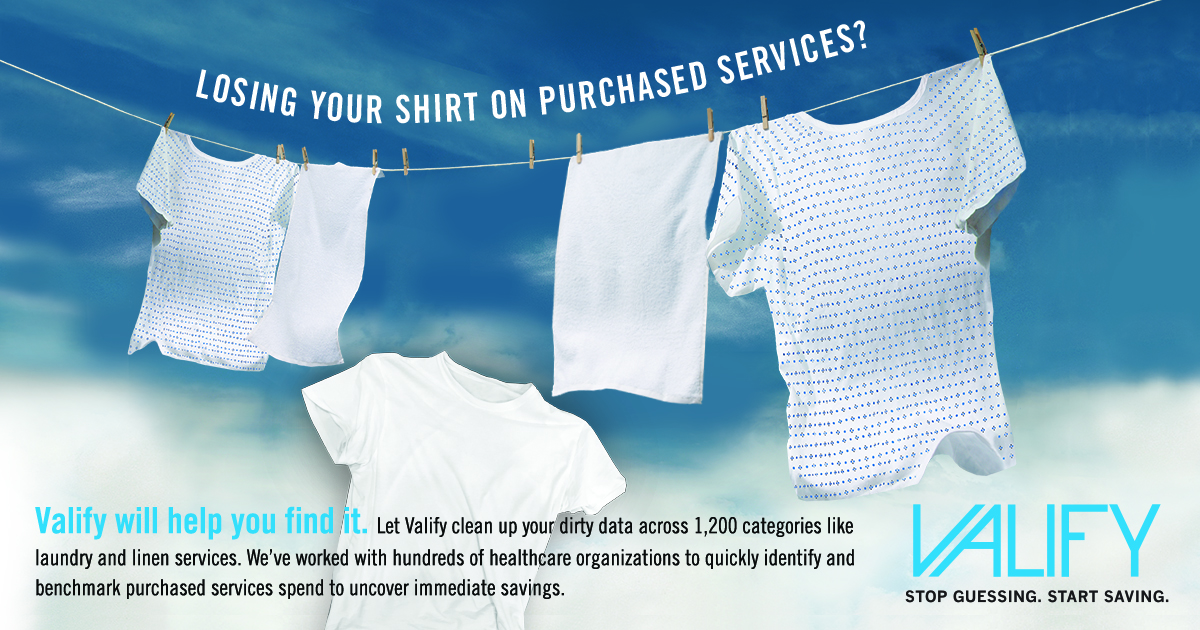
As hospital executives focus on surviving major industry changes such as new payment models and shrinking reimbursements, the cost reduction spotlight seems to be focused more on M&A activity and labor reductions rather than purchased services. This is despite the potential to achieve significant savings without disrupting patient care.
It’s time to shift focus if you want to hit your savings goals. Fragmented processes, isolated information sources and team members working in silos are no longer excuses for losing your shirt on purchased services.
At least 35 percent of a hospital’s non-labor budget comprises of purchased services spending, and the average savings per category is 20 percent or more. Monitoring and reducing these costs is essential in light of tightening budgets and the shift to value-based payment models.
Visibility into Spending
Valify supports a consistent and transparent purchasing process with tools that enable you to analyze and benchmark performance among your own facilities as well as against industry peers.
First, it centralizes and cleanses your spend data and presents it in an intuitive web-based tool. You can then easily compare your consolidated and standardized information across departments and facilities; identify your top vendors and spending categories; and view on- and off-contract spend. You can drill into categories with high spend or vendor variation. This is the foundation for building a proactive work plan. The next step is to benchmark your performance.
Benchmarking spending across all facilities within a health system, as well as against peer organizations is crucial for identifying real savings opportunities. With the right benchmarking and analytics tool, hospitals can potentially realize tens of millions of dollars in purchased services savings.
Greater Insights and Savings with New Category Benchmarking
Valify benchmarking doesn’t stop at key performance indicator (KPI) metrics; it presents a detailed picture of true costs and utilization at the category-level. KPI benchmarking can tell you where there might be a problem, but category benchmarking specifically defines the problem and provides data that can be used to improve performance. For example, laundry spend per adjusted patient day is a common KPI, but is merely directional. Category benchmarking reveals additional actionable metrics such as spend per pound of laundry, the number of pounds generated per patient day, and how service contracting decisions impact your overall costs.
Our new category benchmarking feature can help:
- Turn data-driven insights into empowered decision-making that improves performance in a category
- Understand cost drivers to achieve best-in-class pricing and performance
- Powerfully negotiate with vendors while armed with peer benchmark data
- Understand the market price and how current pricing compares
- Expedite the RFP process with automated data collection, detailed analysis and breakdown of key contracting terms
- Ensure realized savings using dynamic dashboards and savings trackers
- Monitor KPIs to comply with JCAHO requirements and achieve internal performance targets
If you’ve been losing your shirt on purchased services, we can help you get it back!
Join us at Booth 03 in the Gold Room during the 2016 IDN Summit to learn how you can begin uncovering savings with our new category benchmarking feature that analyzes pricing, utilization and contract terms. Before you leave, take this quick cost comparison survey (click here for link) to see how you stack up against your industry peers.

